Hypertext-Visualisierungstechniken im Web
Matthias Müller-Prove
Seminarbeitrag an der Universität Hamburg, Fachbereich Informatik
Vortrag am 8.1.2001, im LEM
letzte Änderung:
A. Benutzerperspektive
Wo im Hypertextnetzwerk befinde ich mich? – Wie bin ich hierher gekommen?
Wieviel der Website habe ich schon gesehen? – Wieviel fehlt mir noch?
Wohin führt mich dieser Link? klick mich
Site Design
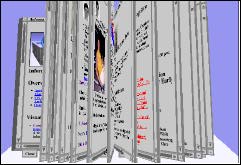
Buch Metapher
Kai Krause, Byteburg, Das Buch
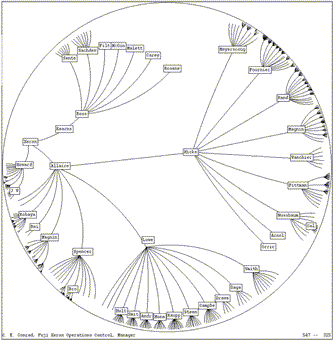
Site Map
Site Map einer Seminar Web-Site zum Thema Kai Krause
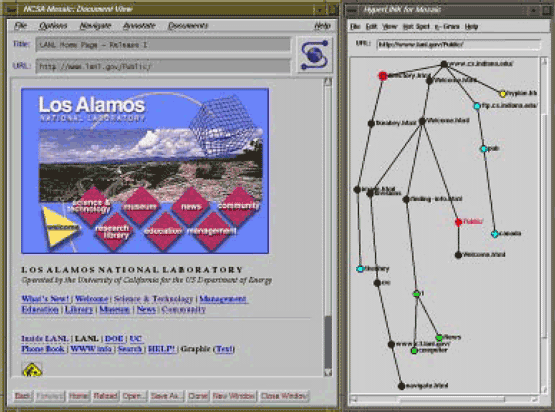
WebBrowser-Erweiterungen
HyperLINK – Visualization of WWW Navigation. T. Alan Keahey, Reid Rivenburgh:, ACM HyperText '96
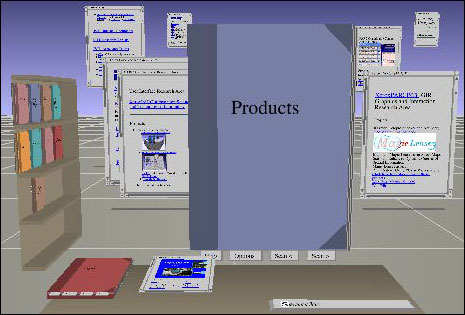
[Card/Robertson/York 96] Stuart K. Card, George G. Robertson, and William York .The WebBook and the Web Forager: An Information Workspace for the World-Wide Web . ACM CHI 96
B. Perspektive des Web-Designers
Wie ist die Struktur der Web-Site? – Wie kann ich sie bearbeiten?
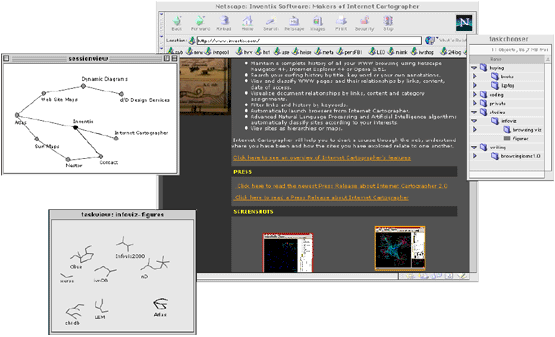
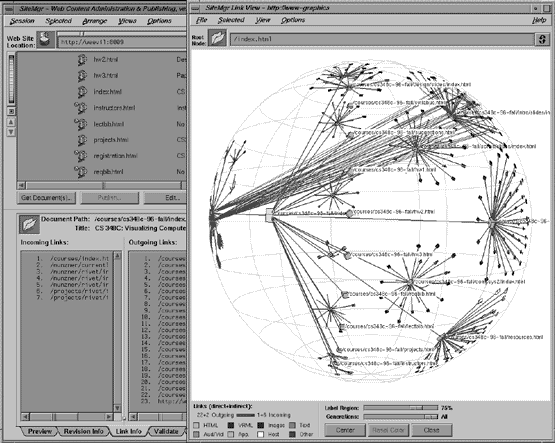
Site View / Site Design
MAPA: a system for inducing and visualizing hierarchy in websites. David Durand and Paul Kahn, from the 9th ACM Conference on Hypertext and Hypermedia (HT'98); June, 1998, Pittsburgh, PA.
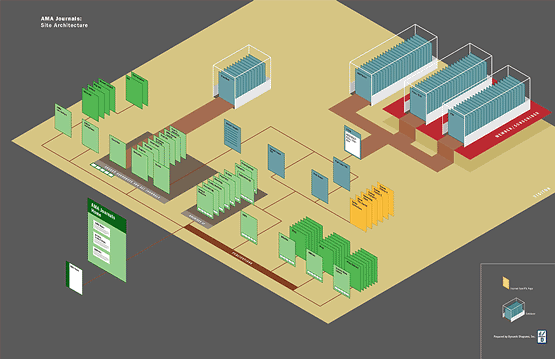
Site Architecture Diagram
Client: Publications of the American Medical Association
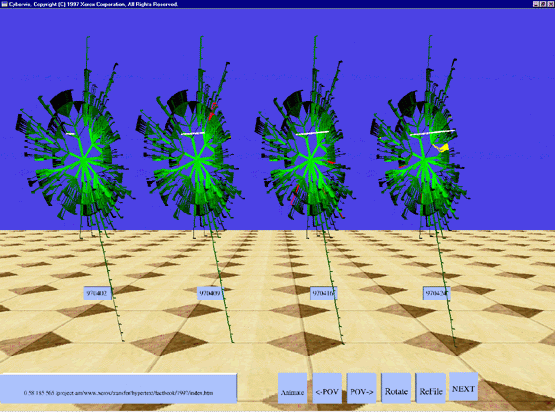
Cone Trees
Xerox Information Visualizer
[Robertson/Card/Mackinlay93] George G. Robertson, Stuart K. Card, and Jock D. Mackinlay. Information Visualisation using 3D Interactive Animation, Comm. ACM Vol. 36 No. 4
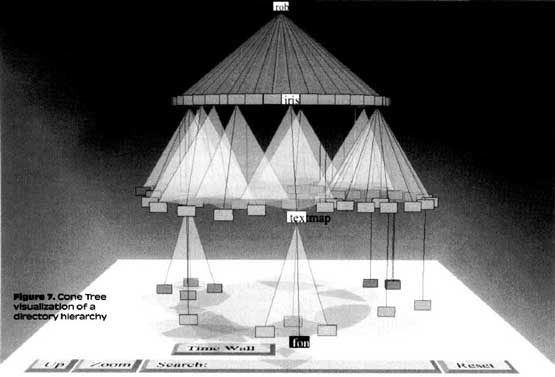
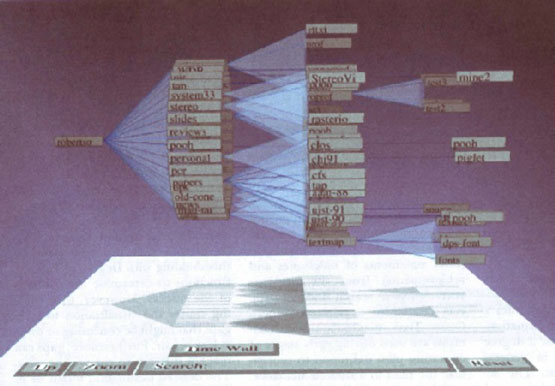
Carrière, R. Kazman, Interacting with Huge Hierarchies: Beyond Cone Trees (ps.Z), Proceedings of IEEE Information Visualization '95, (Atlanta, GA), October 1995, pp. 74-81.
Hyperbolic Trees
[Lamping/Rao/Pirolli 95] John Lamping, Ramana Rao, and Peter Pirolli. A Focus+Context Technique Based on Hyperbolic Geometry for Visualizing Large Hierarchies. CHI ’95
Browsing a large hierarchy, like an organization chart or a directory structure, is difficult, because the hierarchies typically grow exponentially. Such exponentially growing structures don't fit well in the Euclidean plane, or even in Euclidean 3-space.
But we can pick a better geometry. Hyperbolic geometry affords an exponentially growing space, so we lay out a hierarchy in the hyperbolic plane. Then we use the Poincare model to provide a fisheye view on a display, as shown in the picture. The user can focus on whatever part interests them while seeing a context of the entire hierarchy.
This visualization is available commercially from InXight, a Xerox company
Visualizing the Structure of the World Wide Web in 3D Hyperbolic Space (The Geometry Center. University of Minnesota)
Abstract: We visualize the structure of sections of the World Wide Web by constructing graphical representations in 3D hyperbolic space. The felicitous property that hyperbolic space has ``more room'' than Euclidean space allows more information to be seen amid less clutter, and motion by hyperbolic isometries provides for mathematically elegant navigation. The 3D graphical representations, available in the WebOOGL or VRML file formats, contain link anchors which point to the original pages on the Web itself. We use the Geomview/WebOOGL 3D Web browser as an interface between the 3D representation and the actual documents on the Web. The Web is just one example of a hierarchical tree structure with links ``back up the tree'' i.e. a directed graph which contains cycles. Our information visualization techniques are appropriate for other types of directed graphs with cycles, such as filesystems
with symbolic links.
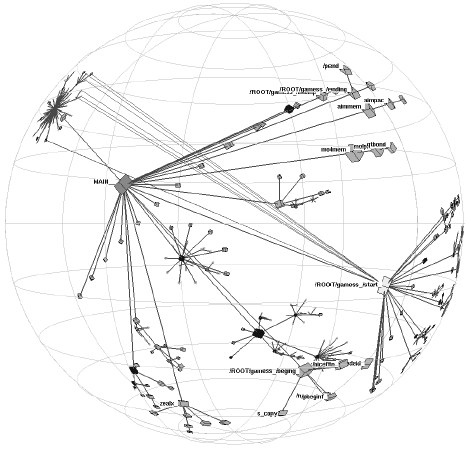
H3
Drawing Large Graphs with H3Viewer and Site Manager (Tamara Munzner Proceedings of Graph Drawing '98, Montreal, Canada, August 1998, Lecture Notes in Computer Science 1547, pp. 384-393, Springer-Verlag
Large Graph Exploration with H3Viewer and Site Manager (Video)
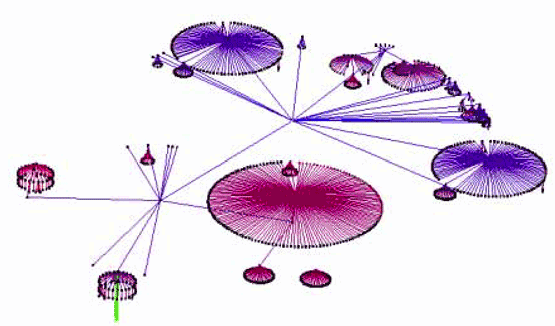
WebQuery: Searching and Visualizing the Web through Connectivity
Dr. Ed Huai-hsin Chi
Ed H. Chi, James Pitkow, Jock Mackinlay, Peter Pirolli, Rich Gossweiler, Stuart K. Card. Visualizing the Evolution of Web Ecologies. In Proc. of ACM CHI 98 Conference on Human Factors in Computing Systems, pp. 400--407, 644--645. ACM Press, 1998. Los Angeles, California.
Literaturvorgaben
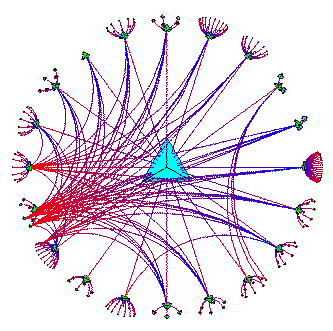
| [Hendley et al. 95] | Hendley / Drew / Wood / Beale. Narcissus: Visualising Information. IEEE 1995 |
| [Andrews 95] | Andrews, Keith. Visualising Cyberspace: Information Visualisation in the Harmony Internet Browser. IEEE 1995 |
| [Lüders/Ernst 95] | Lüders, Peter / Ernst, Rolf. Improving Browsing in Information by the Automatic Display Layer. IEEE 1995 |
| [Brown/Benford/Snowdon 96] | Brown, Chris / Benford, Steve / Snowdon, Dave. Collaborative Visualization of Large Hypermedia Databases. ERCIM workshop on CSCW and the Web. 1996 |
| [Chen 97] | Chen, Chaomei. Structuring and Visualising the WWW by Generalised Similarity Analysis. ACM HyperText 97 |
| [Mukherjea/Hara 97] | Mukherjea, Sougata / Hara, Yoshinori. Focus+Context Views of World-Wide Web Nodes. ACM HyperText 97 |
| [Mayer 2000a] | Matthias Mayer. Kontextvisualisierung: BrowsingIcons und BrowsingGraphs zur Verbesserung der Orientierung und Navigation im World Wide Web In: Ohly, P.; Rahmstorf, G.; Sigel, A. (Hrsg.) Fortschritte in der Wissensorganisation Bd. 6, Würzburg: Ergon Verlag, 2000 (Proceedings der 6. Tagung der Deutschen Sektion der Internationalen Gesellschaft für Wissensorganisation Hamburg, 23.-25. September 1999) Der Inhalt entspricht weitgehend Mayer 2000b. |
| [Mayer 2000b] | –––––. Contextual Web Visualization: BrowsingIcons and BrowsingGraphs to support Orientation and Navigation in the World Wide Web Submitted to the InfoVis2000 Conference. |
| Mayers PhD Projekt | browsing icons to visualize web history |
| Quellenverzeichnis LEM – Visualisierung & Hypertext |
Weiteres
- Aharef Mai 2006: Websites as graphs
- treevis.net – A Visual Bibliography of Tree Visualization 2.0 *beta* by Hans-Jörg Schulz
- GeoSpacial Network Vizualization /2019 /via
Eingehende Links
Diese Seite wird freundlicherweise zitiert von
FH Aachen > FB Design > Seminar: Information Mapping- dotorg der Uni Weimar am 3.12.2001
Design Process: Virtual/Real (Diplomarbeit von Anja Peter und Klaus Birk, 2003)